Pricing Your Apalachicola Waterfront Income Property in 2026
October 1, 2026 by Melissa Chandler
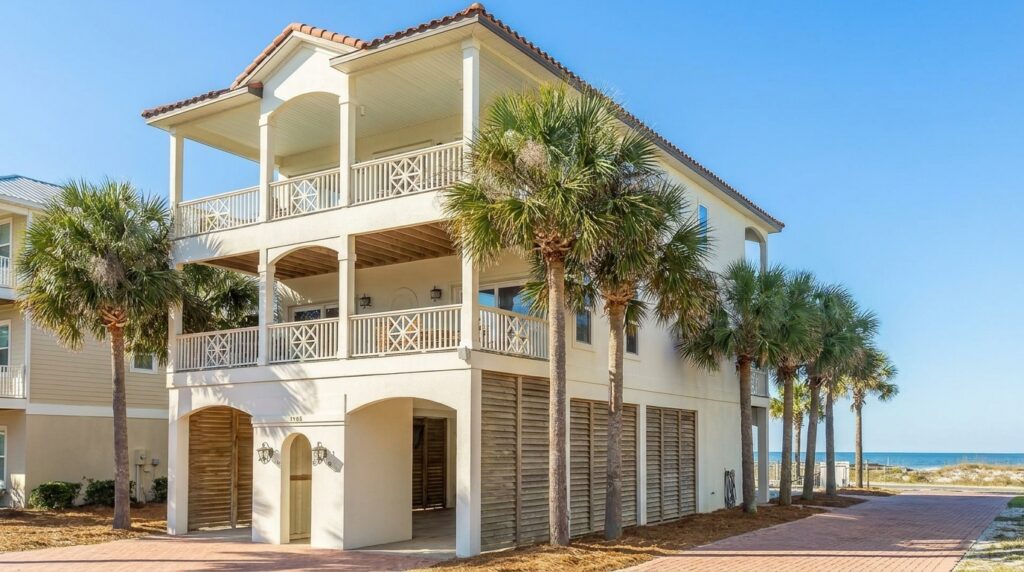
How do I accurately price my Apalachicola FL waterfront income property in 2026 when there are so few comparable sales in the downtown historic district?
You combine three valuation methods: expanded geographic comps from across the Forgotten Coast, an income-based capitalization approach using your property’s rental revenue, and a price-per-square-foot analysis adjusted for waterfront and historic-district premiums.
Why Pricing in Apalachicola’s Historic District Is So Difficult Right Now
If you own a waterfront income property in downtown Apalachicola, you already know the challenge. Only 77 total properties sold across the entire 32320 zip code in the past twelve months, per Foreclosure.com data as of September 2026. The downtown historic district, bounded by the Apalachicola River, Apalachicola Bay, 17th Street, and Jefferson Street with its 652 historic buildings, represents a small fraction of those transactions. For a waterfront property that also generates rental income? You may be looking at fewer than a handful of true comparable sales in any given year.
I’ve been selling real estate on this coast for over 13 years and have closed more than 300 transactions across Franklin County. Pricing in a thin market like Apalach is not a spreadsheet exercise. It requires layering multiple valuation approaches on top of each other and reading the market with local intuition that no algorithm can replicate.
Why Traditional Comparable Sales Fall Short in Apalachicola
Here is the core problem. In most Florida markets, your agent pulls three to five similar properties that sold within the last six months, within a half-mile radius, and adjusts for differences. In Apalachicola’s downtown historic district, that approach breaks down almost immediately.
The price range for homes in the 32320 zip code spans from $40,000 to $3,699,000, according to RealtyTrac data from March 2026. The average home price sits at $343,333 (per Foreclosure.com, September 2026), but that number blends tiny inland cottages with premium waterfront estates, making “average” nearly meaningless for your specific property.
What makes your waterfront income property even harder to comp? It sits in a district where the average year built is 1974 (per Anchor Realty data, June 2026), but many of the most desirable historic structures predate the Civil War. A restored 1850s cottage producing short-term rental income on the bay simply does not compare to a 1990s ranch house two blocks inland.
So what do you do instead? You build a pricing case, not just pull comps.
Three Valuation Methods That Work for Apalachicola Waterfront Properties
Method 1: Expand Your Comparable Geography Along the Forgotten Coast
When downtown Apalachicola does not have enough recent sales, you look outward. St. George Island waterfront real estate in the 32328 zip code shows a median sales price of $778,230 (per RealtyTrac, March 2026), with prices ranging from $129,995 to $6,600,000. Eastpoint, Carrabelle, and Port St. Joe waterfront transactions can also serve as reference points after adjustments.
You are not comparing apples to apples here. You are comparing waterfront to waterfront, then adjusting for Apalachicola’s unique walkability, its three James Beard-nominated restaurants, the cultural density of the Dixie Theater and the Owl Cafe, and the historic character that no new-construction community can replicate. Those adjustments are where local expertise matters most. Having handled over 300 transactions across Franklin County, including investment property opportunities in Florida, I can tell you that the historic-district premium is real, but it needs to be quantified carefully for each property.
Method 2: The Income Approach for Rental Properties
If your property generates income, whether through short-term vacation rentals or long-term leases, the capitalization rate method gives you a valuation framework that does not depend on comparable sales at all.
Here is what you need to know about current rental economics. Median rent in Apalachicola is $1,600 per month as of September 2026, per Foreclosure.com, with average rents ranging from $680 to $2,820 per month. A waterfront property in the downtown historic district with bay views and walkability to Battery Park, Market Street shops, and restaurants will command the upper end of that range for long-term tenants, and potentially much more as a nightly vacation rental during peak season.
You calculate the net operating income (gross rental revenue minus operating expenses, insurance, taxes, and management costs), then divide by the prevailing capitalization rate for similar coastal income properties. This gives buyers a clear picture of the return they are purchasing, which is often more persuasive than sales comps in a thin market.
Method 3: Price Per Square Foot With Adjustments
The median price per square foot in Apalachicola was $342 over the last three months, up 23% year-over-year, according to recent MLS-derived data. Other sources place the average between $257 per square foot (RealtyTrac, 32320 zip code, March 2026) and $292 per square foot (Anchor Realty, June 2026).
That spread tells you something important: waterfront, condition, historic character, and views create enormous variation. Your waterfront income property will command the upper range or well above it. The key is documenting why, with specific adjustments for your property’s river or bay frontage, its rental track record, and the irreplaceable location within the walkable downtown grid.
What Apalachicola’s Current Market Conditions Mean for Your Pricing Strategy
You cannot price your property in a vacuum. The broader market context matters, and right now, several forces are pulling in different directions.
On the softening side: Home values in Apalachicola decreased by 0.453% between June 2025 and June 2026, per automated valuation models. Year-over-year values are down 1.22%. Inventory surged from 47 homes for sale (April 2025) to 125 (March 2026), a 165.96% increase, per RealtyTrac. About 18.0% of current listings have cut their asking price.
On the strength side: The median sold price jumped from $266,100 to $307,800 between April 2025 and March 2026, a 15.67% increase, per RealtyTrac. The recent three-month median sale price hit $350,000. Forecasts from valuation models suggest Apalachicola home prices may rise from $293,301 to $313,965 over the next year.
Here is what this means for you. The listing-to-sold price gap in Apalachicola is roughly 20.7% (the median listing price is $388,200, while the median sold price is $307,800, per RealtyTrac, March 2026). Properties are taking an average of 160 days on market, per Anchor Realty data as of June 2026. If you overprice, you will sit. And every week your waterfront income property sits, potential buyers start wondering what is wrong with it.
What I tell my clients is this: in a market with this kind of gap between asking and selling prices, strategic underpricing or precise pricing based on a well-documented income approach will outperform aspirational pricing every single time.
The Listing-to-Sold Price Gap and How to Use It in Apalachicola
That roughly 20.7% difference between median listing price and median sold price deserves your close attention. It signals that many Apalachicola sellers are overpricing, then negotiating down or letting their listings expire.
You can use this to your advantage. When your pricing is backed by a documented income approach, expanded geographic comps with adjustments, and a clear price-per-square-foot analysis, you stand apart from sellers who just picked a number. Buyers in this market, including the new cohort of remote workers relocating from Atlanta, Nashville, and the Florida I-4 corridor, respond to pricing that tells a story they can verify.
Franklin County’s price-to-income ratio sits at about 6.79 times the local median household income of $62,734, per county-level data. That is roughly 38% above the Florida average. Buyers know this. They are shopping carefully. Your pricing needs to demonstrate clear value, whether that value comes from income potential, irreplaceable location within walking distance of Battery Park and the Owl Cafe, or the historic character of a district laid out in the 1830s by the Apalachicola Land Company.
Insurance, Taxes, and Carrying Costs That Affect Your Apalachicola Property Value
Buyers of income properties in Apalachicola are doing their math, and you should anticipate the numbers they are running. Average property taxes in Apalachicola are about $5,100 per year. Citizens, Florida’s state-backed insurer, covers 115 homes in Franklin County at an average premium of roughly $2,575 annually. Adding mortgage costs at today’s rates (around 6.30% to 6.52% for a 30-year fixed, per recent Freddie Mac data as of April 2026), owning the typical Franklin County home takes about 41.3% of median income in principal and interest alone.
What does this mean for pricing your property? Buyers will discount your asking price by their anticipated insurance and maintenance costs. If your property has a strong rental history that offsets these carrying costs, present that data clearly. It becomes a pricing asset, not just background information.
With 33 five-star reviews from past clients and a specialization in income-generating properties, I can help you package your rental performance data in a way that speaks directly to the investor buyers who are most likely to pay top dollar for your waterfront property.
Frequently Asked Questions
How many comparable sales exist for downtown Apalachicola waterfront properties?
Very few. Only 77 total properties sold across the entire 32320 zip code in the past twelve months, per Foreclosure.com as of September 2026. Downtown waterfront income properties represent a tiny subset. This is precisely why you need to layer income-based valuation and expanded geographic comps rather than relying solely on traditional sales comparisons.
What is the current median price per square foot in Apalachicola?
It varies by source, ranging from $257 per square foot (RealtyTrac, 32320 zip code, March 2026) to $342 per square foot for recent three-month sales (MLS-derived data). Waterfront properties in the historic district typically command the upper end of this range or above, depending on condition, views, and rental income.
How long are homes taking to sell in Apalachicola in 2026?
The average days on market in Apalachicola is 160, according to Anchor Realty data as of June 2026. The broader Franklin County median is 92 days. Waterfront income properties that are priced accurately based on documented income and comparable analysis tend to move faster than this average.
What is the current median rent in Apalachicola?
Median rent is $1,600 per month as of September 2026, per Foreclosure.com, with the average ranging from $680 to $2,820 per month. Waterfront properties in the downtown historic district typically command the higher end of that range, especially as short-term vacation rentals during peak season.
Why is the gap between listing price and sold price so large in Apalachicola?
The median listing price is $388,200 while the median sold price is $307,800 (per RealtyTrac, March 2026), a gap of roughly 20.7%. This suggests widespread overpricing. Sellers who document their pricing with income data and adjusted comps typically close that gap significantly.
How do I account for the historic district premium when pricing?
The downtown historic district contains 652 historic buildings, and its walkable character with access to restaurants, galleries, and the waterfront creates measurable value. You quantify this by comparing price per square foot for historic-district sales versus non-district sales and by documenting the rental premium that historic character commands from vacation guests.
What valuation method works best for income properties in thin markets?
The income approach, using capitalization rates, is your strongest tool. It values the property based on what it actually earns rather than what a neighbor’s different-type property sold for. Pair it with expanded geographic comps from St. George Island and the broader Forgotten Coast for a well-rounded pricing case.
Are home values going up or down in Apalachicola right now?
It depends on the timeframe. Values decreased by 0.453% between June 2025 and June 2026 per automated valuation models. However, the median sold price rose 15.67% from April 2025 to March 2026, per RealtyTrac. The market is mixed, which makes accurate pricing more important than ever.
How does insurance cost affect my property’s market value in Apalachicola?
Citizens insurance averages about $2,575 annually in Franklin County. Buyers factor this into their affordability calculations. If your property’s rental income more than covers insurance and carrying costs, present that clearly in your marketing materials, as it directly supports your asking price.
Should I get an appraisal before listing my Apalachicola waterfront property?
In a thin market, a pre-listing appraisal can be valuable, but understand its limitations. Appraisers in markets like ours may need to pull sales from 12 to 24 months ago and rely more heavily on the income and cost approaches. A well-documented income analysis prepared with your agent can complement the appraisal and strengthen your pricing position.
The Bottom Line
Pricing a waterfront income property in Apalachicola’s downtown historic district requires more than pulling three comps and splitting the difference. You need the income approach, expanded Forgotten Coast comparables with adjustments, and a price-per-square-foot analysis that accounts for what makes your property irreplaceable: the bay views, the walkability to Market Street, the 652-building historic district, and the rental income it generates.
I grew up on this coast. My family moved here in 1968, and I have spent 13 years and more than 300 transactions learning what drives value in this market. If you are thinking about pricing your Apalachicola waterfront property, I would rather have an honest conversation about what the data actually supports than tell you what you want to hear. Call me at 850-653-7893, or stop by my office at 140 W 1st Street on St. George Island. Let’s build a pricing strategy that gets your property sold, not one that just gets it listed.
*Melissa Chandler, Realtor, Melissa Chandler Real Estate. Licensed in Florida (License #3280547). Rated 5/5 stars by 33 past clients. Market data referenced in this article is drawn from publicly available sources including Foreclosure.com, RealtyTrac, Anchor Realty market reports, and Franklin County records. All figures carry the date ranges noted. This blog is for informational purposes and does not constitute a formal appraisal or guarantee of value.*